Introductory courses on coordination chemistry traditionally introduce Crystal Field Theory as a useful model for simple interpretation of spectra and magnetic properties of first-row transition metal complexes. In addition, Crystal Field Stabilisation Energy (CFSE) calculations are often used to explain the variation of their radii and various thermodynamic properties. Such calculations predict that for octahedral systems d3 and d8 should be the most stable and for tetrahedral systems, although always less stable than the corresponding octahedral systems, the d2 and d7 would be the most favourable.
A more detailed interpretation of spectra relies on the development of the concept of multi-electron energy states and Russell-Saunders coupling. Most textbooks [1-9] pictorially present the expected electronic transitions by the use of Orgel diagrams or Tanabe-Sugano diagrams [10], or a combination of both. To this end, nearly all inorganic textbooks include Tanabe-Sugano diagrams, often as an Appendix.
At The UWI, we have used Orgel diagrams to cover high-spin octahedral and tetrahedral configurations, except those with a d2 octahedral configuration or d5 ions (either stereochemistry). For d5, no spin-allowed transitions occur hence no Orgel diagram is possible and the Tanabe-Sugano diagram is introduced to help interpret the spin-forbidden bands. For d2 octahedral, where characterisation of ν2 and ν3 is made difficult since generally only 2 of the 3 expected transitions are observed and the lines due to 3A2g and 3T1g(P) cross, we have once again used a Tanabe-Sugano diagram.
To make use of the Tanabe-Sugano diagrams provided in textbooks for all configurations, it would be expected that they should at least be able to cope with typical spectra for d3, d8 octahedral and d2, d7 tetrahedral systems. This is not the case. The diagrams presented are impractical, being far too small. To make matters worse, the diagram for chromium(III) d3 systems is extremely limited (Δ/B range of 0 - 30) and for simple NH3 or acac complexes would require a small amount of extrapolation, whereas for the [Cr(CN)6]3- ion, Δ/B corresponds to greater than 45! The final blow is that the diagrams for d5 and d6 in the original Tanabe-Sugano paper were incorrect and these errors has been perpetuated in most text-books.
Tanabe-Sugano diagrams for non-octahedral stereochemistry are generally not available, although for tetrahedral systems it is possible to use the d10-n octahedral diagrams if it is remembered that Δ is likely to be roughly half of the octahedral value and that the g subscripts should be dropped. Alternatively, spectral interpretation of cobalt(II) d7 tetrahedral systems can be done by reverting to Orgel diagrams. (Examples of d2 tetrahedral complexes are not very common.)
A set of UV/Vis spectra (in JCAMP-DX format) as well as spreadsheets and JAVA applets giving the Tanabe-Sugano diagrams are made available and a comparison of interpretation methods presented.
Crystal (and with extension, Ligand) Field Theory has proved to be an extremely simple but useful method of introducing the bonding, spectra and magnetism of first-row transition metal complexes.
To quote from the Preface in the 1969 text by Schlafer and Gliemann[9]:"It is hardly possible today to discuss the chemistry of the transition metals, as offered in general lectures on inorganic chemistry, without employing ligand field theory. It is difficult to find a better example of how useful meaningfully chosen models can be for understanding a large body of exceedingly varied experimental results. Nevertheless, only comparatively few basic concepts are required for a first qualitative understanding of the theory".
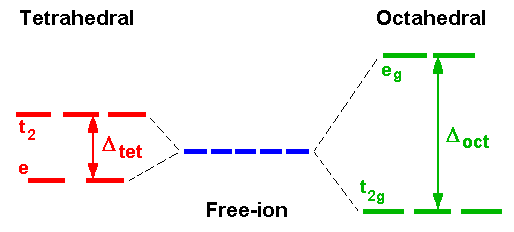
In the interpretation of spectra, it is usual to start with an octahedral Ti3+ complex with a d1 electronic configuration. Crystal Field Theory predicts that because of the different spatial distribution of charge arising from the filling of the five d-orbitals, those orbitals pointing towards bond axes will be destabilised and those pointing between axes will be stabilised.

The t2g and eg subsets are then populated from the lower level first which for d1 gives a final configuration of t2g1 eg0.
The energy separation of the two subsets equals the splitting value Δ and ligands can be arranged in order of increasing Δ which is called the spectrochemical series and is essentially independent of metal ion.
For ALL octahedral complexes except high spin d5, simple CFT would therefore predict that only 1 band should appear in the electronic spectrum corresponding to the absorption of energy equivalent to Δ. If we ignore spin-forbidden lines, this is borne out by d1, d9 as well as to d4, d6.
The observation of 2 or 3 peaks in the electronic spectra of d2, d3, d7 and d8 high spin octahedral complexes requires further treatment involving electron-electron interactions. Using the Russell-Saunders (LS) coupling scheme, these free ion configurations give rise to F ground states which in octahedral and tetrahedral fields are split into terms designated by the symbols A2(g), T2(g) and T1(g).
To derive the energies of these terms and the transition energies between them is beyond the needs of introductory level courses and is not covered in general textbooks[10,11]. A listing of some of them is given here as an Appendix. What is necessary is an understanding of how to use the diagrams, created to display the energy levels, in the interpretation of spectra.
Two types of diagram are available: Orgel and Tanabe-Sugano diagrams.
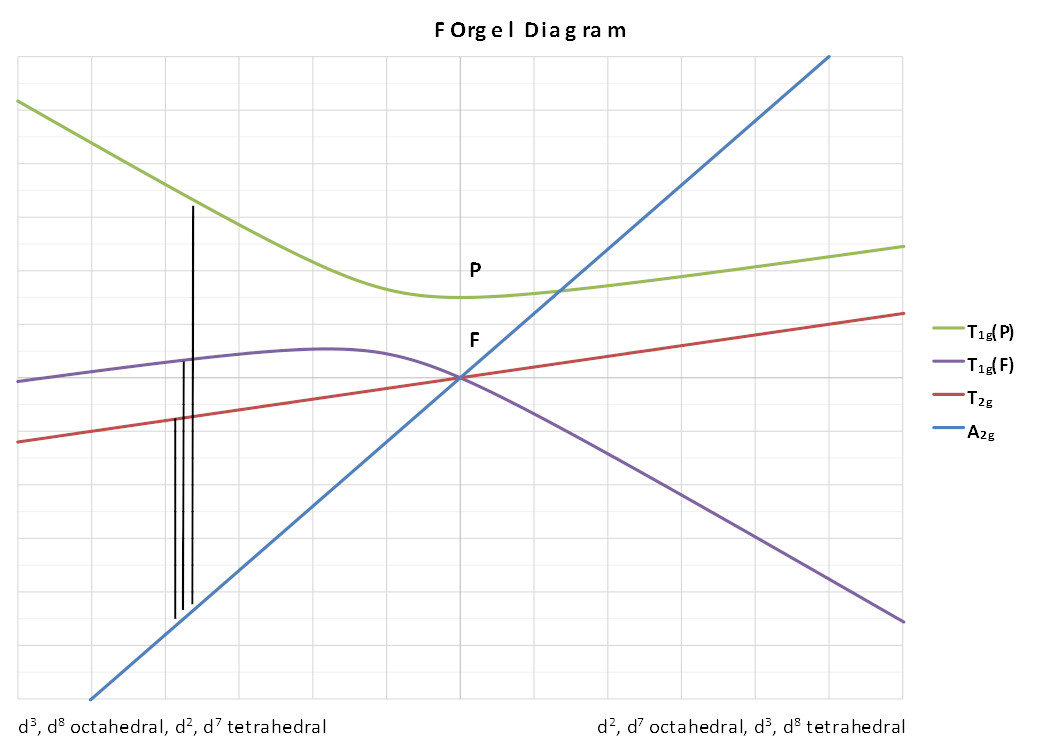
A simplified Orgel diagram (not to scale) showing the terms
arising from the splitting of an F state is given below. The spin
multiplicity and the g subscripts are dropped to make the diagram
more general for different configurations.
A spreadsheet is available on request, as well as an
SVG version.

The lines showing the A2 and T2 terms are linear and depend solely on Δ. The lines for the two T1 terms are curved to obey the non-crossing rule and as a result introduce a configuration interaction in the transition energy equations.
The left-hand side is applicable to d3 , d8 octahedral complexes and d7 tetrahedral complexes. The right-hand side is applicable to d2 , d7 octahedral complexes.
Looking at the d3 octahedral case first, 3 peaks can be predicted which would correspond to the following transitions:
Here C.I. represents the configuration interaction which is generally either taken to be small enough to be ignored or taken as a constant for each complex.
In the laboratory component of the course we measure the absorption spectra of some typical chromium(III) complexes and calculate the spectrochemical splitting factor, Δ. This corresponds to the energy found from the first transition above and as shown in Table 1 is generally between 15,000 cm-1 and 27,000 cm-1 depending on the type of ligand present.
Table 1. Peak positions for some octahedral Cr(III) complexes (in cm-1).|
Complex
|
ν1
|
ν2
|
ν3
|
ν2/ν1
|
ν1/ν2
|
Δ/B
|
Ref
|
| Cr3+ in emerald |
16260
|
23700
|
37740
|
1.46
|
0.686
|
20.4
|
13 |
| K2NaCrF6 |
16050
|
23260
|
35460
|
1.45
|
0.690
|
21.4
|
13 |
| [Cr(H2O)6]3+ |
17000
|
24000
|
37500
|
1.41
|
0.708
|
24.5
|
This work |
| Chrome alum |
17400
|
24500
|
37800
|
1.36
|
0.710
|
29.2
|
4 |
| [Cr(C2O4)3]3- |
17544
|
23866
|
? |
1.37
|
0.735
|
28.0
|
This work |
| [Cr(NCS)6]3- |
17800
|
23800
|
? |
1.34
|
0.748
|
31.1
|
4 |
| [Cr(acac)3] |
17860
|
23800
|
? |
1.33
|
0.752
|
31.5
|
This work |
| [Cr(NH3)6]3+ |
21550
|
28500
|
? |
1.32
|
0.756
|
32.6
|
4 |
| [Cr(en)3]3+ |
21600
|
28500
|
? |
1.32
|
0.758
|
33.0
|
4 |
| [Cr(CN)6]3- |
26700
|
32200
|
? |
1.21
|
0.829
|
52.4
|
4 |
For octahedral Ni(II) complexes the transitions would be:
where C.I. again is the configuration interaction and as before the first transition corresponds exactly to Δ.
For M(II) ions the size of Δ is much less than for M(III) ions (around 2/3) and typical values for Ni(II) are 6500 to 13000 cm-1 as shown in Table 2.
Table 2. Peak positions for some octahedral Ni(II) complexes (in cm-1).|
Complex
|
ν1
|
ν2
|
ν3
|
ν2/ν1
|
ν1/ν2
|
Δ/B
|
Ref
|
| NiBr2 |
6800
|
11800
|
20600
|
1.74
|
0.576
|
5
|
13 |
| [Ni(H2O)6]2+ |
8500
|
13800
|
25300
|
1.62
|
0.616
|
11.6
|
13 |
| [Ni(gly)3]- |
10100
|
16600
|
27600
|
1.64
|
0.608
|
10.6
|
13 |
| [Ni(NH3)6]2+ |
10750
|
17500
|
28200
|
1.63
|
0.614
|
11.2
|
13 |
| [Ni(en)3]2+ |
11200
|
18350
|
29000
|
1.64
|
0.610
|
10.6
|
3 |
| [Ni(bipy)3]2+ |
12650
|
19200
|
? |
1.52
|
0.659
|
17
|
3 |
For d2 octahedral complexes, few examples have been published. One such is V3+ doped in Al2O3 where the vanadium ion is generally regarded as octahedral, Table 3.
Table 3. Peak positions for an octahedral V(III) complex (in cm-1).|
Complex
|
ν1
|
ν2
|
ν3
|
ν2/ν1
|
ν1/ν2
|
Δ/B
|
Ref
|
| V3+ in Al2O3 |
17400
|
25200
|
34500
|
1.45
|
0.690
|
30.8
|
13 |
Interpretation of the spectrum highlights the difficulty of using the right-hand side of the Orgel diagram above since none of the transitions correspond exactly to Δ and often only 2 of the 3 transitions are clearly observed.
The first transition can be unambiguously assigned as:
3T2g ← 3T1g transition energy = 4/5 * Δ + C.I.But, depending on the size of the ligand field (Δ) the second transition may be due to:
3A2g ← 3T1g transition energy = 9/5 * Δ + C.I.for a weak field (Δ/B' < 13.5) or
3T1g(P) ← 3T1g transition energy = 3/5 * Δ + 15B' + 2 * C.I.for a strong field (Δ/B' > 13.5).
The transition energies of these terms are clearly different and it is often necessary to calculate (or estimate) values of B, Δ and C.I. for both arrangements and then evaluate the answers to see which fits better.
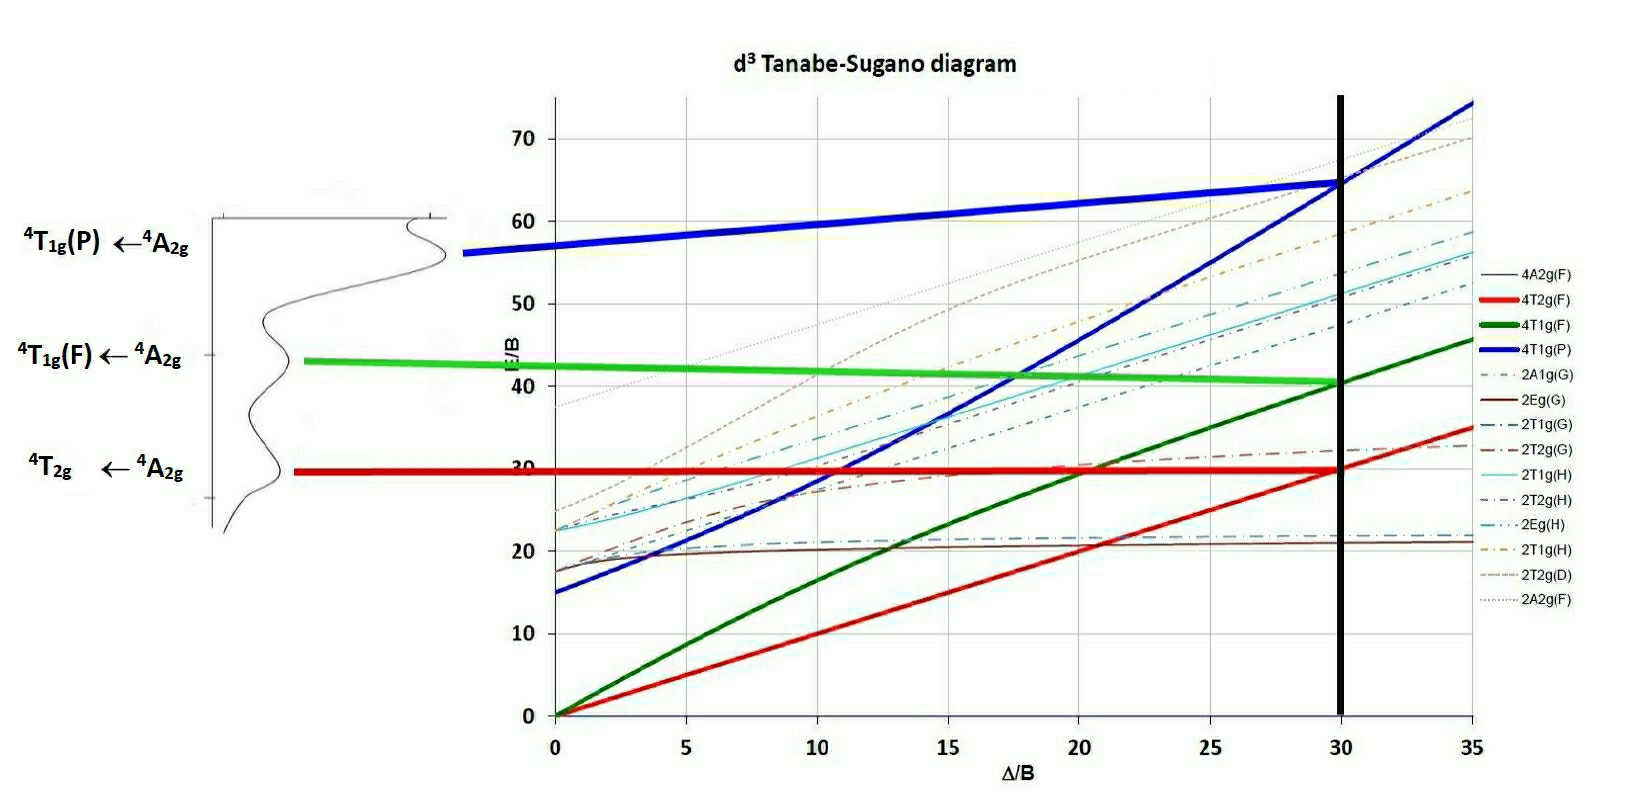
The difference between the 3A2g and the 3T2g (F) lines is equivalent to Δ so in this case Δ is equal to either:The first obvious difference to the Orgel diagrams shown in general textbooks is that Tanabe-Sugano diagrams are calculated such that the ground term lies on the X-axis, which is given in units of Δ/B. The second is that spin-forbidden terms are shown and third that low-spin complexes can be interpreted as well, since for the d4 - d7 diagrams a vertical line is drawn separating the high and low spin terms.
The procedure used to interpret the spectra of complexes using Tanabe-Sugano diagrams is to find the ratio of the energies of say the second to first absorption peak and from this locate the position along the X-axis from which Δ/B can be determined. Then using the E/B value on the Y-axis and knowing the value of E1=ν1 B' can be determined. From the Δ/B found on the X-axis then Δ is found as well. Having found Δ/B, then tracing a vertical line up the diagram will give the values (in E/B units) of all spin-allowed and spin-forbidden transitions.
N.B. Another approach has been to use the inverse of this ratio, ie of the first to second transition and so both values are recorded in the Tables.
As an example, using the observed peaks found for the Cr(III) spectrum shown on the side of the TS diagram D/B' is estimated to be 30. The E/B' for the first transition is given as 30 as well from which if ν1 is 18,000 cm-1 then B' can be calculated as 600 cm-1. The third peak can then be predicted to occur at 65 * 600 = 39,000 cm-1 or 256 nm (in the UV region and probably hidden by charge transfer or solvent bands).

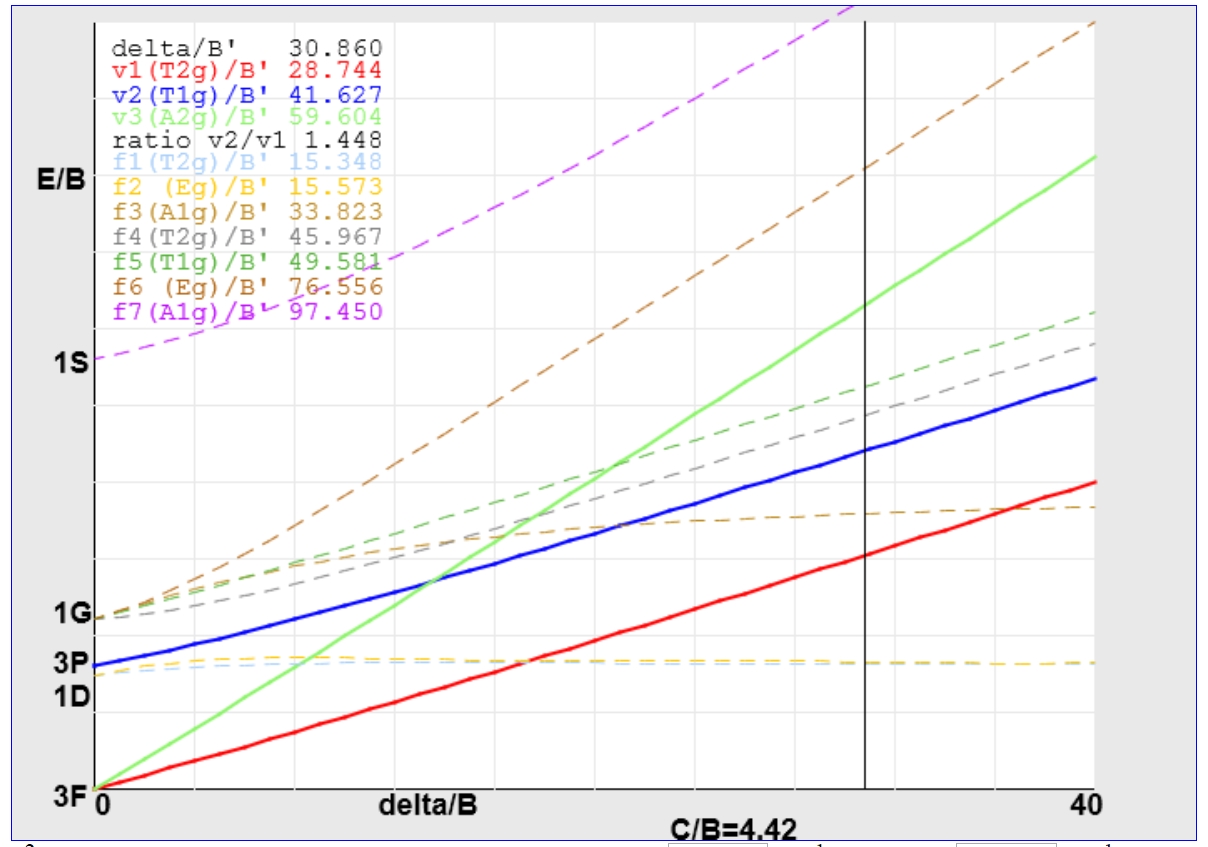
For the V(III) example treated previously using an Orgel diagram, the value of Δ/B' determined from the appropriate JAVA applet is around 30.86.

Following the vertical line upwards leads to the assignment of the first transition to 3T2g ← 3T1g and the second and third to 3T1g (P) ← 3T1g (blue line) and 3A2g ← 3T1g (green line) respectively.
The value of B' calculated from the Y-intercept is ~605 cm-1 giving Δ a value of roughly 18670 cm-1, significantly larger than the 17100 cm-1 calculated above and shows the sort of variation possible from these two methods.
It is important to remember though that the width of many of these peaks is often 1-2,000 cm-1 so as long as it is possible to assign peaks unambiguously, the techniques remain valuable.
To overcome the problem of small diagrams, it was decided to
generate our own Tanabe-Sugano diagrams using spreadsheets.
This was done, using the transition energies given in the Appendix,
for the spin-allowed transitions and using CAMMAG to generate
the energies of the spin-forbidden transitions.
Larger diagrams in SVG for expansion are available for
d2, d3
d7 and d8.
Even so, the method of finding the correct X-intercept is somewhat tedious and time-consuming and a different approach was devised using JAVA applets.
The JAVA applets display the spin-allowed and low-lying spin-forbidden transitions and when the user clicks on any region of the graph then the values of ν2/ν1 and ν3/ν1 are displayed. In addition, the values of Δ/B and the Y-intercepts are given as well. This simplifies the process of determining the best fit for Δ/B.
The expected ranges for the ratio of ν2/ν1 are:
These ratios show the need for a certain degree of precision in attempting to analyse the spectra, especially for d7 and d8. It has been suggested that instead of using ν2/ν1 that any two ratios can be used and graphs of these plots were produced by Lever in the 1960's[11]. Once again though the published diagrams are rather small and so the spreadsheets above contain these charts which can be printed in larger scale. The slopes of the various ratio lines vary greatly and it is useful to examine the region of interest first before deciding on which set of lines should be used for analysis. If only 2 peaks are observed then this is not an option.
Further information for use in laboratory classes is available and some example calculations are available as well.
Transitions calculated for spin-allowed terms in the Tanabe-Sugano diagrams.
Octahedral d3 (e.g. Chromium(III) ).
4T2g ← 4A2g, ν1/B= Δ/B
4T1g(F) ← 4A2g, ν2/B= ½{15 + 3( Δ/B) - √(225 - 18(Δ/B) + (Δ/B)2 ) }
4T1g(P) ← 4A2g, ν3/B= ½{15 + 3( Δ/B) + √(225 - 18(Δ/B) + (Δ/B)2 ) }
from this, the ratio ν2/ν1 would become:
½{15 + 3( Δ/B) - √(225 - 18(Δ/B) + ( Δ/B)2 ) } / Δ/B
and the range of Δ/B required is from ~15 to ~55
Octahedral d8 (e.g. Nickel(II) ).
3T2g ← 3A2g, ν1/B= Δ/B
3T1g(F) ← 3A2g, ν2/B= ½{15 + 3(Δ/B) - √(225 - 18(Δ/B) + (Δ/B)2 ) }
3T1g(P) ← 3A2g, ν3/B= ½{15 + 3(Δ/B) + √(225 - 18(Δ/B) + (Δ/B)2 ) }
from this the ratio ν2/ν1 would become:
½{15 + 3(Δ/B) - √(225 - 18(Δ/B) + (Δ/B)2 ) } /Δ/B
and the range of Δ/B required is from ~5 to ~17
Octahedral d2 (e.g. Vanadium(III) ).
3T2g ← 3T1g, ν1/B= ½{(Δ/B) - 15 + √(225 + 18(Δ/B) + (Δ/B)2 ) }
3T1g(P) ← 3T1g, ν2/B= √(225 + 18(Δ/B) + (Δ/B)2 )
3A2g ← 3T1g, ν3/B= ½{ 3 (Δ/B) -15 + √(225 + 18(Δ/B) + (Δ/B)2 ) }
from this the ratio ν2/ν1 would become:
√(225 + 18(Δ/B) + (Δ/B)2 ) / ½{(Δ/B) - 15 + √(225 + 18(Δ/B) + (Δ/B)2 ) }
and the range of Δ/B required is from ~15 to ~35
Tetrahedral d7 (e.g. Cobalt(II) ).
4T2 ← 4A2, ν1/B= Δ/B
4T1 (F) ← 4A2, ν2/B= ½{15 + 3(Δ/B) - √(225 - 18(Δ/B) + (Δ/B)2 ) }
4T1 (P) ← 4A2, ν3/B= ½{15 + 3(Δ/B) + √(225 - 18(Δ/B) + (Δ/B)2 ) }
from this the ratio ν2/ν1 would become:
½{15 + 3(Δ/B) - √(225 - 18(Δ/B) + (Δ/B)2 ) } / Δ/B
and the range of Δ/B required is from ~3 to ~8.
To the students in my C21J class who have unwittingly helped formulate my ideas on how to teach this material, I am deeply grateful.
Thanks are due as well to Christopher Muir and Debbie Facey for help in developing the JAVA applets.
| updated | |
| Go to the CONFCHEM (current) Home Page. | Return to the Summer'99 CONFCHEM. |