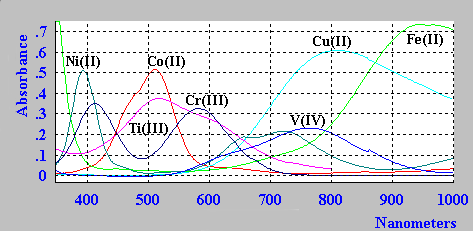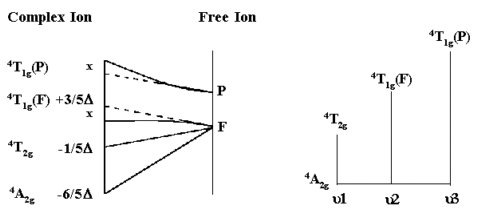


For d3,d8 octahedral and d2, d7 tetrahedral complexes, the above diagrams can be used to interpret the observed electronic absorption spectra.
Take for example the Cr3+ aquo ion
[Cr(H2O)6]3+.
From the simplified Orgel diagram, three
absorptions are expected. In practice, the spectrum is found to
contain 3 bands which occur at 17,000 cm-1, 24,000
cm-1 and 37,000 cm-1. Of which only two are
shown above.
μ1 corresponds exactly to Δ (Delta) and since the lowest band is found at 17,000 cm-1 then this enables us to measure Δ directly from the spectrum.
The next band is found at 24,000 cm-1 and this can
be equated to:
μ2=9/5Δ - x where
x is the configuration interaction between the T(F)
state and the T(P) state of the same symmetry.
Since Δ is 17,000 and μ2 is observed at 24,000 then x must be 6,600
cm-1.
The last band is seen at 37,000 cm-1 and here
μ3=6/5Δ + 15B + x
where B is one of the RACAH parameters.
Solving for B gives a value of B=667cm-1.
For the free Cr3+ ion, B is ~1030 cm-1 so that in the
complex this term is reduced by ~2/3 of the free ion value.
A large reduction in B indicates a strong Nephelauxetic Effect. The Nephelauxetic Series is given by:
F- > H2O > urea > NH3 > en ~ C2O42- > NCS- > Cl- ~ CN- > Br- > S2- ~ I-Ionic ligands such as F- give a small reduction in B,
 Return to Chemistry, UWI-Mona,
Home Page
Copyright © 1995-2010 by Robert John Lancashire, all rights reserved.
Created and maintained by Prof. Robert J. Lancashire,